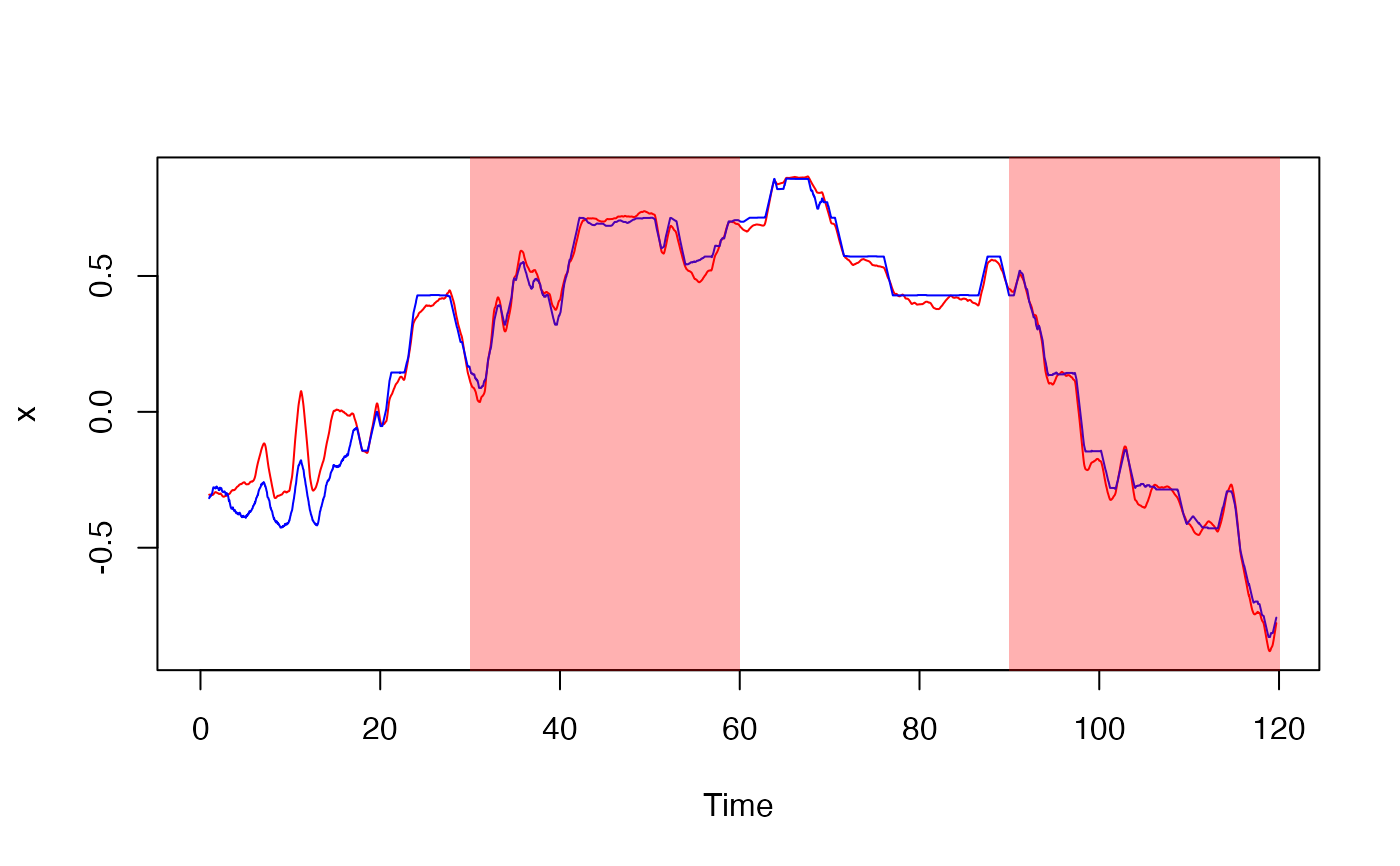
Plot time series data derived from Yoshi Behaviour Rig
Source:R/yoshi_behav_functions.R
plot_ybr.RdPlot time series data derived from Yoshi Behaviour Rig
plot_ybr(
  x,
  filter = FALSE,
  sides = 1,
  randts = FALSE,
  lights = c(on1 = 30, off1 = 60, on2 = 90, off2 = 120),
  lightcol = rgb(1, 0, 0, alpha = 0.3),
  ...
)
Arguments
| x | A (multi-)time series object containing one or more behavioural variables. |
|---|---|
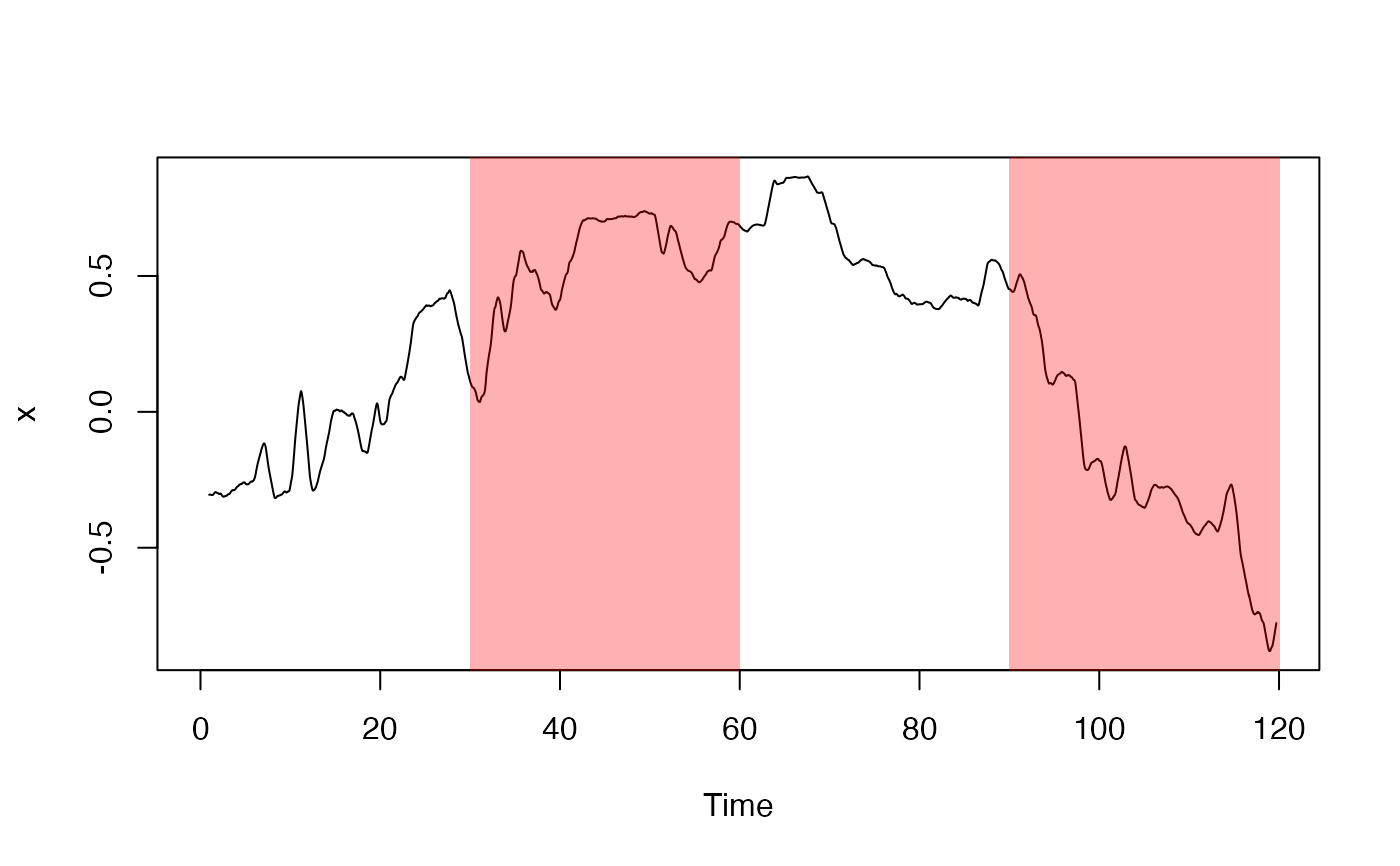
| filter | Either the width in seconds of a simple smoothing filter
or a filter defined according to |
| sides | Whether the filter is causal i.e. for past values only (the
default) or centered around lag=0. See |
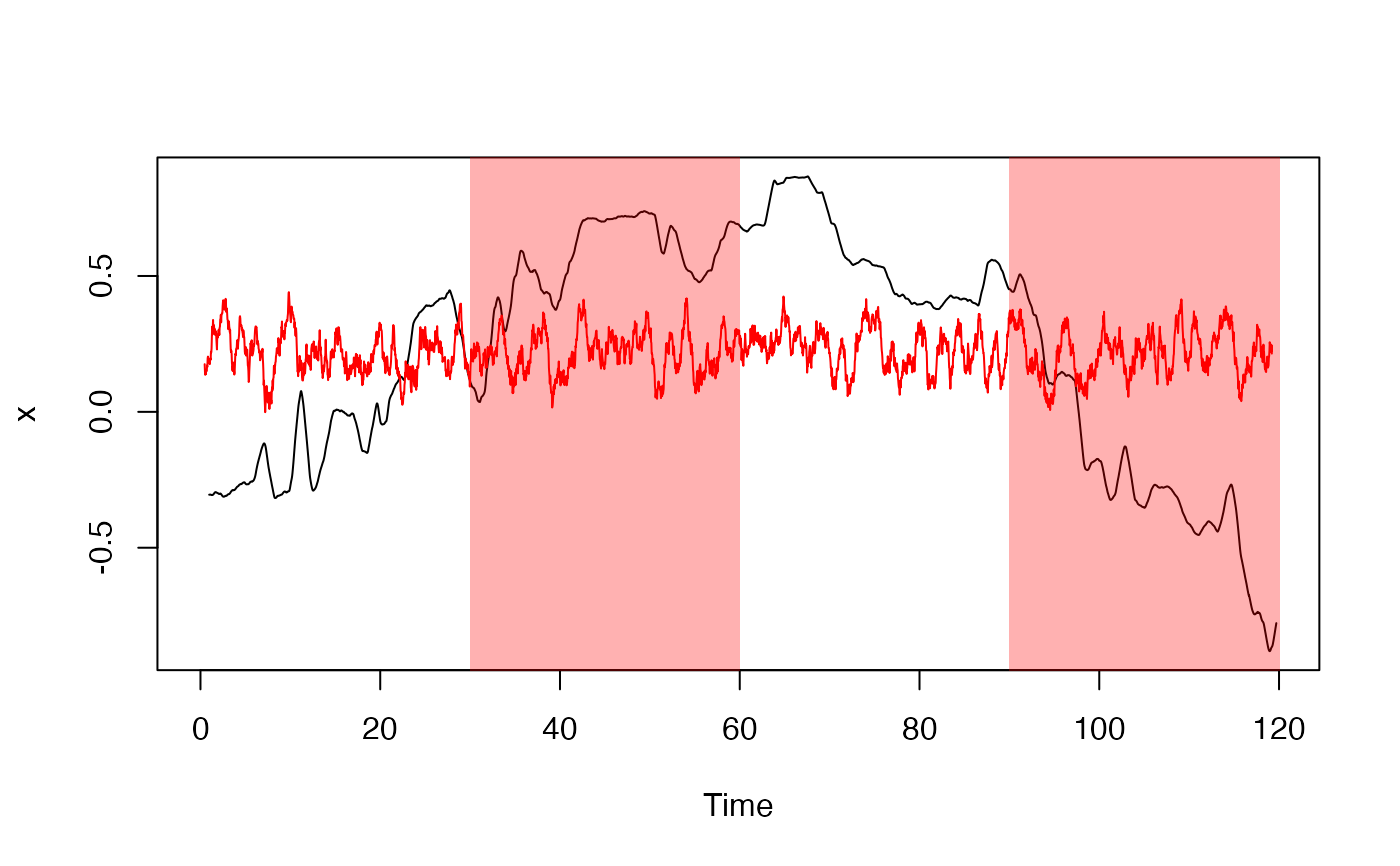
| randts | Whether to include a randomised version of the time series as a second plot. Default to true if data are being filtered |
| lights | A length 2 or more vector defining the lights on/off times for the experiment (in seconds). |
| lightcol | The colour to use to plot the lights on epochs |
| ... | Additional arguments to |
Details
This plot includes an optional smoothed randomised time series which
is made by randomly permuting the timepoints in the main time series and
then applying the same smoothing filter. If you want this time series to be
reliably the same pseudorandom series for publication purposes you may need
to see the random seed (see set.seed)
See also
Other ybr-plot:
plot_smoothed_displacement()
Examples
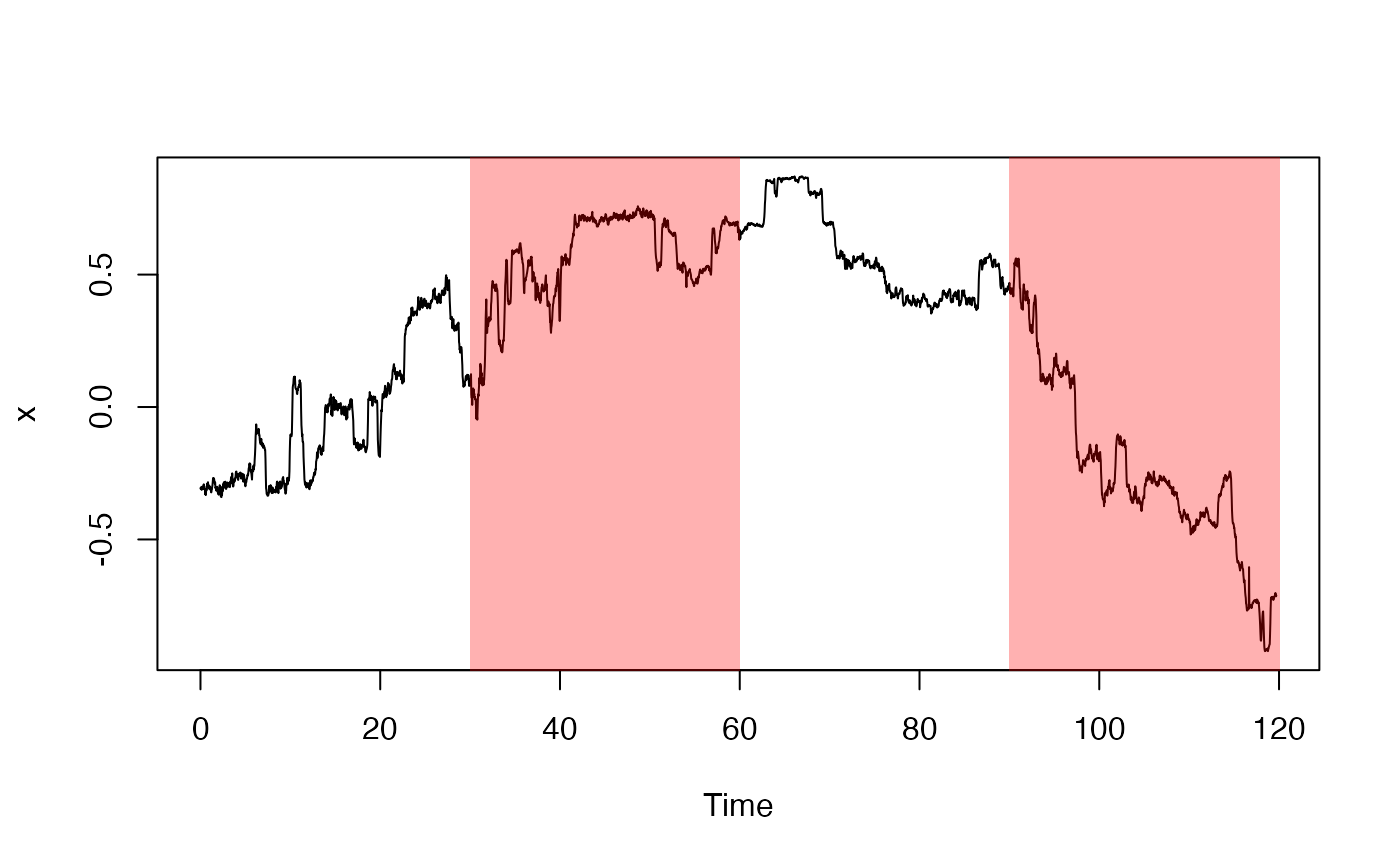
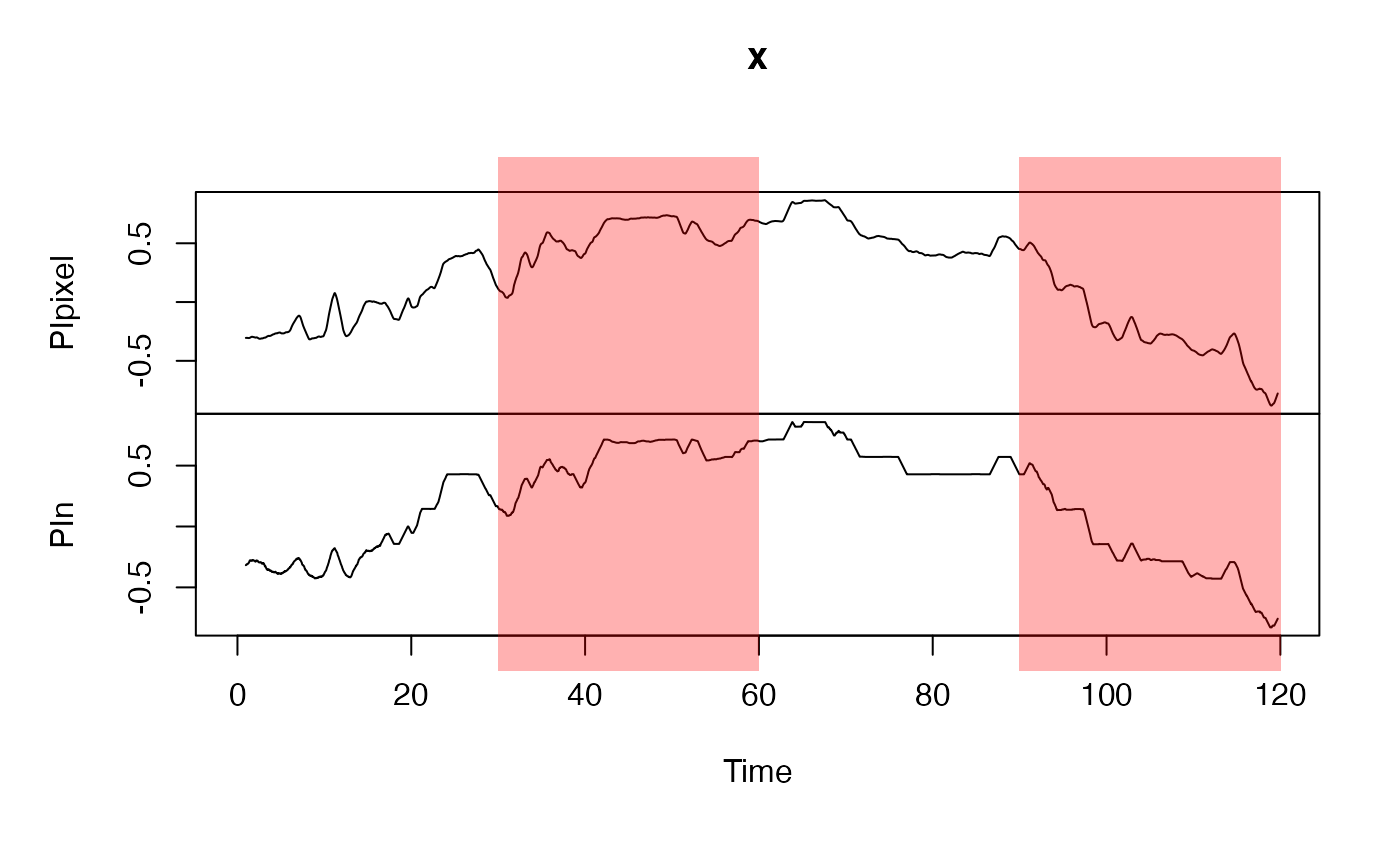
tiffdf=find_ybr_tiffs(system.file("ybr_tiffs", package='flywatch')) summdata=read_ybr_summary(tiffdf$tiff[1]) plot_ybr(summdata[,'PIpixel'], filter=FALSE)plot_ybr(summdata[,'PIpixel'], filter=1)plot_ybr(summdata[,'PIpixel'], filter=1, randts=TRUE)
